

Microbial Community and Diversity in Specialty Teas from Fujian
-
摘要:目的 探明福建特色茶叶中的细菌群落结构特征,以及细菌群落结构在不同种类茶叶间的分布情况。方法 采集福建特色茶叶大红袍、铁观音、花茶共15组样品,通过16S rRNA高通量测序,对不同种类茶叶中细菌的群落结构进行解析。结果 经过高通量测序以及统计分析,最终共获得11 472个OTU,包括37个门,95个纲,150个目,207个科,277个属。比较3种茶叶,发现大红袍在物种丰度上要高于铁观音与花茶,花茶的物种多样性要高于大红袍与铁观音,且同为乌龙茶的大红袍与铁观音在细菌群落结构上更为相似。在属水平上,10组大红袍样本中共有的优势属为乳球菌属、双歧杆菌属及拟杆菌属,2组花茶样本中共有的优势属为拟杆菌属,3组铁观音中共有的优势菌属为乳球菌属与双歧杆菌属。其中,丰度前10的优势属中有5个为乳酸菌。通过共现网络分析,表明乳酸菌与其显著相关的大部分物种呈互利生长的关系。结论 大红袍与铁观音的优势菌纲为芽孢杆菌纲和放线菌纲,花茶的优势菌纲为梭状芽胞杆菌纲与拟杆菌纲。比较3种茶叶的细菌群落结构,发现茶叶种类可能是影响细菌群落结构变化的重要因素之一,且乳酸菌在3种茶叶中均为主要优势细菌。Abstract:Objective Diversity and distribution of the microbial communities in the specialty teas produced in Fujian were studied.Method Fifteen groups of well-known local teas in the province were collected for an analysis based on the high-throughput sequencing targeting 16S rRNA gene.Result A total of 11 472 OTUs encompassing 37 phyla, 95 classes, 150 orders, 207 families, and 277 genera were isolated from the specimens. In the 3 categories, Dahongpao had the greatest richness on species; the Huacha was the most diversified; and, as oolong teas, Dahongpao and Tieguanyin had a similar microbial structure. In 10 groups of Dahongpao samples, the dominant genera were Lactococcus, Bifidobacterium, and Bacteroides; that in 2 groups of Huacha, Bacteroides; and those in 3 groups of Tieguanyin, Lactococcus and Bifidobacterium. Five of the top 10 dominant genera in the teas were lactic acid bacteria. According to the co-occurrence analysis on network, the lactic acid bacteria exhibited a synergistic growth relationship with most of the other significantly associated species.Conclusion Bacilli and Actinobacteria were the predominant bacteria found in Dahongpao and Tieguanyin, while Clostridia and Bacteroidia in Huacha. A bacterial taxonomy analysis indicated that tea category differentiated the structure of their bacterial communities. Overall, lactic acid bacteria dominantly existed in these teas produced in Fujian.
-
Keywords:
- tea /
- microbial community structure /
- 16S rRNA /
- high throughput sequencing
-
0. 引言
【研究意义】商品猪的生长发育均呈一定的规律性,前期骨骼、肌肉组织生长,后期脂肪组织沉积[1]。当前规模集约化养猪生产普遍采用“三阶段”生长育肥法,即小猪20~50 kg、中猪50~80 kg、大猪80 kg至出栏。“三阶段”生长育肥法虽然操作简便,但由于饲养阶段少,造成同一饲养阶段前期营养不足,后期营养供大于求。有研究证明,猪没有能力调节蛋白质摄取量来满足自身营养需求[2],“三阶段”生长育肥法不仅导致蛋白质等营养物质的浪费,且营养素的不平衡势必降低商品猪的增重和饲料利用率,商品猪饲料转化效率的下降直接关系猪场的养殖成本,并增加环境污染[3],传统的“三阶段”育肥法及其营养供给模式已不能适应精细化养猪生产的需要。【前人研究进展】乔建国等[4]、董志岩等[5]分别开展了“四阶段”和“五阶段”育肥法与“三阶段”育肥法的对比试验,并已证明在生产性能和饲料成本方面,“四阶段”和“五阶段”育肥法明显优于“三阶段”育肥法,主要原因在于猪的营养供给更加精准,饲料转化效率更高。在降低污染物排放方面,有资料报道,欧洲养猪发达国家普遍采用多阶段饲养法,生长肥育猪平均每头日增重增加40~50 g,粪尿排出量减少7%~20%,减轻了对环境的污染[6]。Han等[7]研究表明,相对于单一阶段饲养法,采用三、四阶段饲养法使猪粪氮减少约12%。【本研究切入点】国内关于不同阶段育肥法对生长肥育猪生长性能、胴体品质和肉品质影响方面已有研究[4-5],而在多阶段育肥法对生长肥育猪粪氮、磷排放量影响方面的研究鲜有报道。因此,在养猪与环境污染问题日益突出之际,有必要探讨商品猪不同育肥模式对氮、磷排放量的影响,为精细化养猪生产提供技术支持。【拟解决的关键问题】本研究通过比较分析“三阶段”和“五阶段”育肥法对生长肥育猪表观消化率及粪氮磷排放量的影响,为发展生猪生态养殖提供参考依据。
1. 材料与方法
1.1 试验设计
采用单因子对比饲养试验,试验分成2组(对照组和试验组),每组6个重复。对照组为“三阶段”育肥法及其营养供给模式,3个阶段分别为:20~50、50~80、80~120 kg;试验组为“五阶段”育肥法及其营养供给模式,5个阶段分别为:20~35、35~55、55~75、75~95、95~120 kg。
1.2 试验猪的选择、分组与管理
选择遗传相近、日龄为(63±3)d、平均初始体重为(19.5±1.6) kg杜长大三元杂交阉公猪72头,按体重相近的原则随机分为2组,每组6个重复(栏),每个重复6头猪。预试期6 d,试验期127 d。试验猪舍每个栏圈面积约10 m2,水泥地面,南北卷帘装置。试验猪日饲喂3次,每次投料以料槽内略有余料为准,自由采食,自由饮水。饲养试验于2018年3月在福建优康种猪发展有限公司猪场进行。
1.3 试验饲粮
试验饲粮为玉米-豆粕型,参照NRC(1998)[8]猪的饲养标准配制,饲粮组成与营养水平见表 1。
表 1 饲粮组成与营养水平Table 1. Nutritional composition of forages三阶段育肥Three-stage growing-finishing method/kg 20~50 50~80 80~120 五阶段育肥Five-stage growing-finishing method/kg 20~35 35~55 55~75 75~95 95~120 饲粮组成Compose of diet 玉米Corn/% 70.00 70.00 70.00 70.00 70.00 豆粕Soybean meal/% 23.00 20.00 18.50 14.50 11.00 麦皮Wheat bran/% 3.00 6.00 7.50 11.50 15.00 78.0% L-赖氨酸盐酸盐78.0% L-Lys·HCl/% 0.29 0.29 0.28 0.23 0.21 99.0% DL-蛋氨酸99.0% DL-Met/% 0.12 0.10 0.09 0.04 98.5% L-苏氨酸98.5% L-Thr/% 0.04 0.08 0.07 0.04 0.02 磷酸氢钙CaHPO4 /% 1.01 0.65 0.30 石粉Limestone/% 1.21 1.30 1.40 1.34 1.23 50%氯化胆碱50% Choline chloride/% 0.10 0.10 0.09 0.07 0.07 食盐NaCl/% 0.40 0.40 0.40 0.40 0.40 沸石粉Zeolite powder/% 0.33 0.58 0.87 1.38 1.57 预混料Premix①/% 0.50 0.50 0.50 0.50 0.50 合计Total 100.00 100.00 100.00 100.00 100.00 营养水平/%② 消化能DE/(MJ·kg-1) 13.39 13.31 13.22 13.06 12.89 粗蛋白质CP/% 16.16 15.23 14.68 13.66 12.67 赖氨酸Lys/% 1.02 0.96 0.92 0.80 0.70 可消化赖氨酸Digestible lysine/% 0.93 0.86 0.82 0.70 0.61 可消化蛋氨酸Digestible methionine/% 0.34 0.31 0.29 0.23 0.23 可消化蛋氨酸+可消化胱氨酸Digestible methionine+Digestible cystine/% 0.56 0.52 0.49 0.42 0.38 可消化苏氨酸Digestible threonine/% 0.60 0.56 0.53 0.46 0.40 可消化色氨酸Digestible tryptophan/% 0.19 0.17 0.16 0.14 0.12 钙Ca/% 0.75 0.70 0.65 0.54 0.50 总磷TP/% 0.53 0.48 0.42 0.38 0.30 注:①0.50%预混料向每kg饲粮添加:小猪:VA 8 000 IU,VD3 2 000 IU,VE 35.00 mg,VK3 2.60 mg,VB1 2.60 mg,VB2 8.50 mg,VB6 2.60 mg,VB12 0.03 mg,烟酸28.00 mg,泛酸20.00 mg,叶酸0.30 mg,生物素0.26 mg,Fe 100 mg,Cu 20 mg,Zn 80 mg,Mn 25 mg,I 0.80 mg,Se 0.40 mg;生长猪:VA 6 500 IU,VD3 1 600 IU,VE 30.00 mg,VK3 2.00 mg,VB1 2.00 mg,VB2 7.50 mg,VB6 2.00 mg,VB12 0.025 mg,烟酸23.00 mg,泛酸15.00 mg,叶酸0.25 mg,生物素0.20 mg,Fe 90 mg,Cu 20 mg,Zn 70 mg,Mn 20 mg,I 0.60 mg,Se 0.35 mg;肥育猪:VA 5 000 IU,VD3 1 200 IU,VE 30.00 mg,VK3 1.50 mg,VB1 1.50 mg,VB2 6.50 mg,VB6 1.50 mg,VB12 0.02 mg,烟酸20.00 mg,泛酸钙12.00 mg,叶酸0.20 mg,生物素0.15 mg,Fe 80 mg,Cu 20 mg,Zn 70 mg,Mn 20 mg,I 0.60 mg,Se 0.30 mg;②除粗蛋白质为实测值,其余营养素均为计算值,参考NRC(1998)饲养标准计算。
Note:①The premix provided the following per kg of diets:For piglet stage, VA 8 000 IU,VD3 2 000 IU,VE 35.00 mg,VK3 2.60 mg,VB1 2.60 mg,VB2 8.50 mg,VB6 2.60 mg,VB12 0.03 mg,nicotinic acid 28.00 mg,pantothenic acid 20.00 mg,folic acid 0.30 mg,biotin 0.26 mg,Fe 100 mg,Cu 20 mg,Zn 80 mg,Mn 25 mg,I 0.80 mg,Se 0.40 mg.For growth stage, VA 6 500 IU,VD3 1 600 IU,VE 30.00 mg,VK3 2.00 mg,VB1 2.00 mg,VB2 7.50 mg,VB6 2.00 mg,VB12 0.025 mg,nicotinic acid 23.00 mg,pantothenic acid 15.00 mg,folic acid 0.25 mg,biotin 0.20 mg,Fe 90 mg,Cu 20 mg,Zn 70 g,Mn 20 g,I 0.60 g,Se 0.35 mg.For growth stage, VA 6 500 IU,VD3 1 600 IU,VE 30.00 mg,VK3 2.00 mg,VB1 2.00 mg,VB2 7.50 mg,VB6 2.00 mg,VB12 0.025 mg,nicotinic acid 23.00 mg,pantothenic acid 15.00 mg,folic acid 0.25 mg,biotin 0.20 mg,Fe 90 mg,Cu 20 mg,Zn 70 g,Mn 20 g,I 0.60 g,Se 0.35 mg.For finale stage, VA 5 000 IU,VD3 1 200 IU,VE 30.00 mg,VK3 1.50 mg,VB1 1.50 mg,VB2 6.50 mg,VB6 1.50 mg,VB12 0.02 mg,nicotinic acid 20.00 mg,pantothenic acid 12.00 mg,folic acid 0.20 mg,biotin 0.15 mg,Fe 80 mg,Cu 20 mg,Zn 70 g,Mn 20 g,I 0.60 g,Se 0.30 mg.②Crude protein levels were analyzed values and the others were calculated according to NRC (1998) feeding standard.1.4 测定指标与分析方法
饲料样品:每个阶段的试验饲料分别测定。分别从每个试验料包装袋中取饲料约150 g,共约1 500 g,混匀后按照四分法获取饲料样品,冷藏保存待测。
鲜粪样品:在每个饲养阶段第15 d开始连续收集粪样3 d。用干净的塑料盆快速收集无尿液污染的新鲜粪样约500 g,从中取300 g于铝盒中,按10 mL:100 g的比例加入10%的硫酸稀释液,并加入2滴甲苯防腐,最后将各栏圈3 d收集的粪样混匀,编号后于-20℃冻存。
粪样处理:粪样解冻,105℃快速烘干1 h,再65℃烘干至恒重,粉碎,制成风干样装入磨口瓶中,用于测定粪氮、粪磷含量。
饲粮粗蛋白质表观消化率采用盐酸不溶灰分作为内源指示剂法测定。饲料和粪样总氮含量按照GB/T6432-1994[9]推荐的方法测定,仪器为FOSS公司的KJELTEC2300;饲料和粪样总磷含量采用硫酸双氧水消化-钒钼黄比色法,仪器为上海光谱仪器有限公司Sp-3801原子吸收分光光度计;饲料和粪样中盐酸不溶灰分含量的测定参照张丽英[10]的方法。
表观消化率计算公式按刘钢等[11]的方法。
表观消化率/%=1-[(饲粮盐酸不溶灰分含量/粪中盐酸不溶灰分含量)×(粪中养分含量/饲粮养分含量)]×100;
吸收量/(g·d-1)=平均日采食量/(g·d-1)×饲料养分含量×消化率;
排出量/(g·d-1)=饲料养分摄入量/(g·d-1)-养分吸收量/(g·d-1)。
1.5 数据处理
试验数据用Excel软件进行初步处理后,使用SPSS 13.0软件进行方差分析,采用t检验进行比较和显著性分析,结果用平均值±标准差表示。
2. 结果与分析
2.1 两种阶段育肥法对生长肥育猪氮表观消化率和粪氮排放量的影响
两种阶段育肥法对生长肥育猪氮表观消化率和粪氮排放量的影响结果见表 2、3。由此可见,生长肥育猪饲养全程粪氮排放量合计:“五阶段”育肥法每头猪平均为1 435.29 g,“三阶段”育肥法每头猪为1 528.51 g,“五阶段”育肥法比“三阶段”育肥法每头猪少排放粪氮93.22 g。结合表 1列出的各饲养阶段及相应饲粮蛋白质水平可以看出,“五阶段”育肥法比“三阶段”育肥法不同饲养阶段饲粮蛋白质水平更加精细化,饲养全程饲粮氮的总摄入量“五阶段”育肥法减少361.70 g,因此,在氮表观消化率相近的情况下,“五阶段”育肥法比“三阶段”育肥法粪氮减排的原因主要是全程增加了饲养阶段后饲粮氮的总摄入量减少所致。
表 2 “五阶段”育肥法对生长肥育猪氮表观消化率和粪氮排放量的影响Table 2. Effect of 5-phase-feeding on apparent N digestibility and fecal N in pigs at final growth stage项目
Items育肥阶段Growing-finishing stages 20~35 kg 35~55 kg 55~75 kg 75~95 kg 95~120 kg 平均摄入氮Average N intake/(g·d-1) 39.04±3.12 44.35±2.65 50.73±3.79 59.45±2.95 70.75±4.01 氮吸收量N absorption/(g·d-1) 30.20±4.33 34.42±2.26 39.70±3.53 46.71±3.67 55.72±4.25 粪氮排出量Fecal N excretion/(g·d-1) 8.84±4.02 9.93±4.57 10.53±3.26 12.74±4.43 15.03±4.81 氮表观消化率Apparent N digestibility/% 77.35±4.59 77.62±5.23 78.26±3.51 78.57±5.16 78.76±4.37 饲养天数Feeding days/d 24 30 26 24 23 阶段氮排出量Stage fecal N excretion/g 212.16±34.25 297.90±23.33 273.78±33.72 305.76±34.16 345.69±34.58 表 3 “三阶段”肥育法对生长肥育猪氮表观消化率和粪氮排放量的影响Table 3. Effect of 3-phase-feeding on apparent N digestibility and fecal N in pigs at final growth stage项目
Items育肥阶段Growing-finishing stages 20~50 kg 50~80 kg 80~120 kg 平均摄入氮Average N intake/(g·d-1) 42.40±4.72 51.67±3.63 75.84±4.66 氮吸收量N absorption/(g·d-1) 32.83±3.13 40.41±4.05 59.68±2.51 粪氮排出量Fecal N excretion/(g·d-1) 9.57±3.49 11.26±3.96 16.16±4.17 氮表观消化率Apparent N digestibility/% 77.43±5.23 78.20±4.73 78.69±4.36 饲养天数Feeding days/d 49 41 37 阶段氮排出量Stage fecal N excretion/g 468.93±45.33 461.66±34.47 597.92±45.64 2.2 两种阶段育肥法对生长肥育猪磷表观消化率和粪磷排放量的影响
两种阶段育肥法对生长肥育猪磷表观消化率和粪磷排放量的影响结果见表 4、5。可以看出,生长肥育猪饲养全程粪磷排放量合计:“五阶段”育肥法每头猪平均为421.27 g,“三阶段”育肥法每头猪为461.12 g,“五阶段”育肥法比“三阶段”育肥法每头猪少排放粪磷39.85 g。结合表 1列出的各饲养阶段及相应饲粮总磷水平可以看出,“五阶段”育肥法比“三阶段”育肥法不同饲养阶段饲粮中总磷水平更加细化,饲养全程饲粮磷的总摄入量“五阶段”育肥法减少113.69 g,因此,在磷表观消化率相近的情况下,“五阶段”育肥法比“三阶段”育肥法粪磷减排的原因主要是全程增加了饲养阶段后饲粮磷的总摄入量减少所致。
表 4 “五阶段”肥育法对生长肥育猪磷表观消化率和粪磷排放量的影响Table 4. Effect of 5-phase-feeding on apparent P digestibility and fecal P in pigs at final growth stage项目
Items育肥阶段Growing-finishing stages 20~35 kg 35~55 kg 55~75 kg 75~95 kg 95~120 kg 平均摄入磷Average P intake/(g·d-1) 8.00±1.12 8.74±1.03 9.07±0.71 10.34±0.65 10.47±0.53 磷吸收量P absorption/(g·d-1) 5.08±1.02 5.56±0.91 5.83±0.76 6.69±0.78 6.82±0.47 粪磷排出量Fecal P excretion/(g·d-1) 2.92±1.04 3.18±0.95 3.24±0.72 3.65±0.69 3.05±0.51 磷表观消化率Apparent P digestibility/% 63.53±3.38 63.61±3.29 64.31±3.71 64.67±3.12 65.15±4.02 饲养天数Feeding days/d 24 30 26 24 23 阶段磷排出量Stage fecal P excretion/g 70.08±5.32 95.40±5.66 84.24±4.27 87.60±6.01 83.95±5.22 表 5 “三阶段”育肥法对生长肥育猪磷表观消化率和粪磷排放量的影响Table 5. Effect of 3-phase-feeding on apparent P digestibility and fecal P in pigs at final growth stage项目
Items育肥阶段Growing-finishing stages 20~50 kg 50~80 kg 80~120 kg 平均摄入磷Average P intake/(g·d-1) 8.69±1.07 9.24±0.86 13.19±0.61 磷吸收量P absorption/(g·d-1) 5.53±0.93 5.93±0.79 8.58±0.59 粪磷排出量Fecal P excretion/(g·d-1) 3.16±0.89 3.31±0.84 4.61±0.57 磷表观消化率Apparent P digestibility/% 63.57±3.29 64.20±3.73 65.05±3.46 饲养天数Feeding days/d 49 41 37 阶段磷排出量Stage fecal P excretion/g 154.84±10.35 135.71±16.27 170.57±16.16 2.3 两种阶段育肥法对生长肥育猪全期氮、磷排放量的对比
表 6列出了两种阶段肥育法对生长肥育猪饲养全期饲粮氮、磷摄入量和粪氮、磷排放量的对比情况,从表中看出,两者相比,“五阶段”育肥法比“三阶段”育肥法每头猪饲养全期饲粮N摄入量减少5.17%,差异显著(P < 0.05),饲养全期饲粮P摄入量减少8.79%,差异显著(P < 0.05):饲养全期粪氮排放量减少6.10%,差异显著(P < 0.05),饲养全期粪磷排放量减少8.64%,差异显著(P < 0.05)。
表 6 两种阶段肥育法全期粪N、P排放量对比Table 6. Effect of two feeding programs on fecal N and P of pigs at final growth stage项目
Items五阶段肥育
Five-phase-
feeding三阶段肥育
Three-phase-
feeding全期饲粮N摄入量Total feed N intake/kg 6.64±0.04a 7.00±0.04b 全期饲粮P摄入量Total feed P intake/kg 1.18±0.02a 1.29±0.03b 全期粪N排泄量Total fecal N excretion/kg 1.44±0.05a 1.53±0.08b 全期粪P排泄量Total fecal P excretion/kg 0.42±0.03a 0.46±0.03b 注:同行数据不同肩标小写字母表示差异显著(P < 0.05)。
Note:In the same row, values with different small letter superscripts mean significant difference (P < 0.05).3. 讨论
目前国内对生长肥育猪的饲养大多采用“三阶段”育肥法,每个阶段生长肥育猪分别供给相应营养水平的饲料,“三阶段”育肥法每个阶段的时间间隔比较长,而猪的实际生长是一个连续的渐进过程,其营养需求每天都在发生变化。因此“三阶段”饲养的每一个阶段的某些时期,营养物质的供给量会超过其实际需要量而造成浪费,不仅增加养殖成本,且过量无法吸收的营养将排出体外,对周边环境造成污染。与“三阶段”育肥法相比,多阶段育肥法可明显降低猪只氮、磷的排放。欧洲养猪发达国家普遍采用较多阶段进行饲养,与单阶段饲养相比,生长肥育猪平均每头猪日增重增加40~50 g,粪尿排出量减少7%~20%,P2O5减少12%~24%,减轻了对环境的污染压力[6]。Han等[7]的研究表明,相对于单阶段饲养法,采用三、四阶段饲养法使猪粪氮减少约12%。本试验结果表明,“五阶段”育肥法比“三阶段”育肥法每头猪饲养全程粪氮、磷排放量显著减少6.10%和8.64%,试验结果与相关研究相似,说明采用较多阶段育肥法可显著降低生长肥育猪粪氮、磷排放量,减轻生猪养殖对环境的污染。
王文君等[12]报道在不影响猪生长性能的前提下,生长肥育猪饲粮粗蛋白质水平平均每降低1个百分点可减少大约8%~10%的总氮排放量。闫俊书等[13]研究表明,在饲粮中添加植酸酶能显著减少肥育猪粪磷排放量。本试验采用低蛋白、低磷基础饲粮研究多阶段育肥法,达到了节省蛋白质饲料和磷饲料资源、降低饲料成本的同时,实现饲料氮和磷的更加高效减排,具有显著的经济和生态效益,对规模养猪具有实际参考意义。
由于现代商品猪生产机械化程度较高,许多规模养殖企业采用机械送料和自动化可调节的饲喂设施,而且生产中普遍采用以周为单位的分批次生产,同批次的商品猪均匀度较高,这些条件匀便于多阶段生产操作的实施。
本试验结果表明,商品猪采用“五阶段”育肥方法,能显著降低饲粮氮、磷的摄入量和粪氮、磷的排放量,具有良好的环境生态效益;“五阶段”育肥法具有可操作性,可适用于我国规模养猪生产。
-
![]()
图 2 15组样品在纲水平上的群落结构
Figure 2. Community structure at class level in 15 tea sample groups
![]()
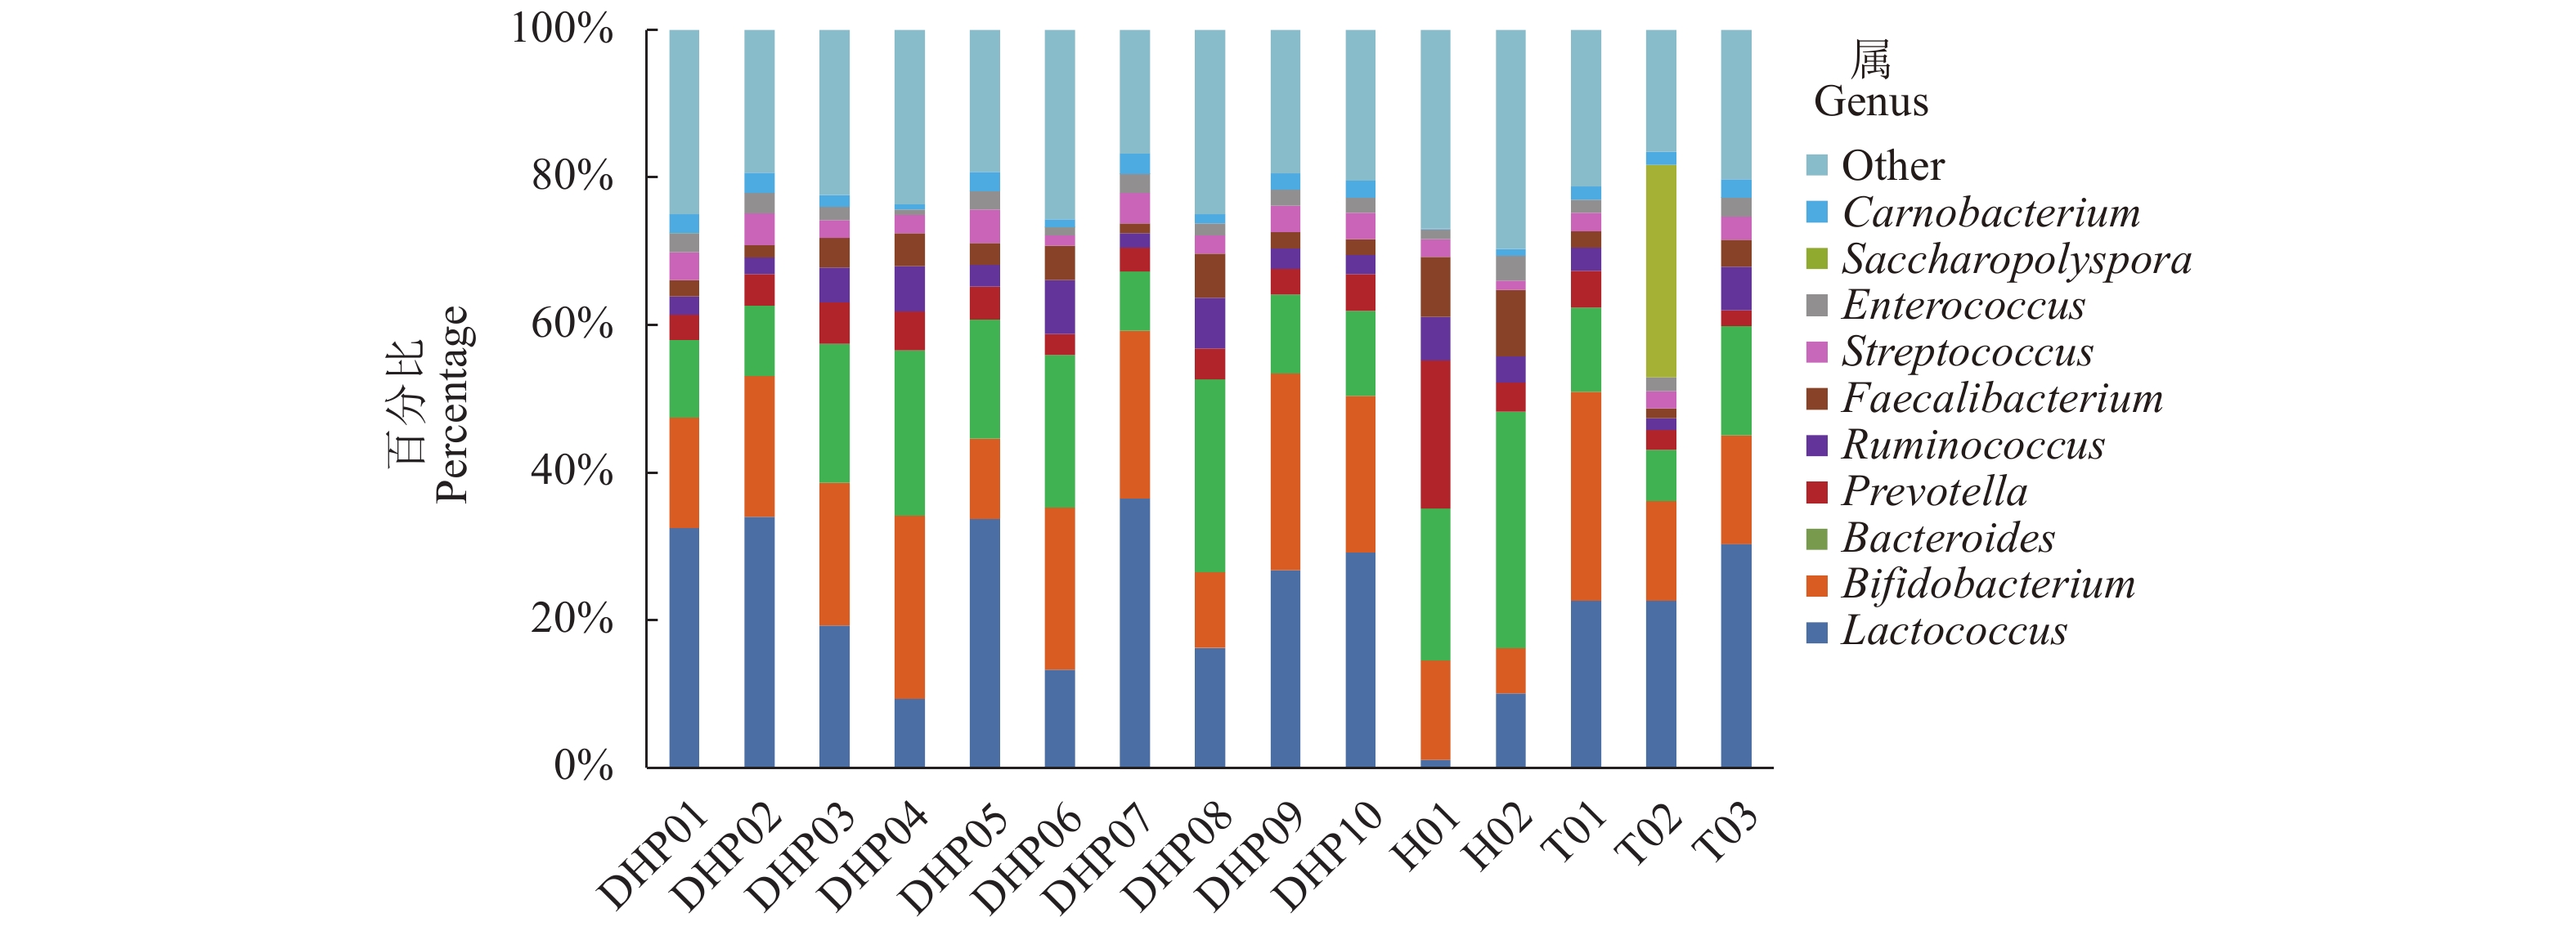
图 3 15组样品在属水平上的群落结构
Figure 3. Community structure at genus level in 15 tea sample groups
![]()
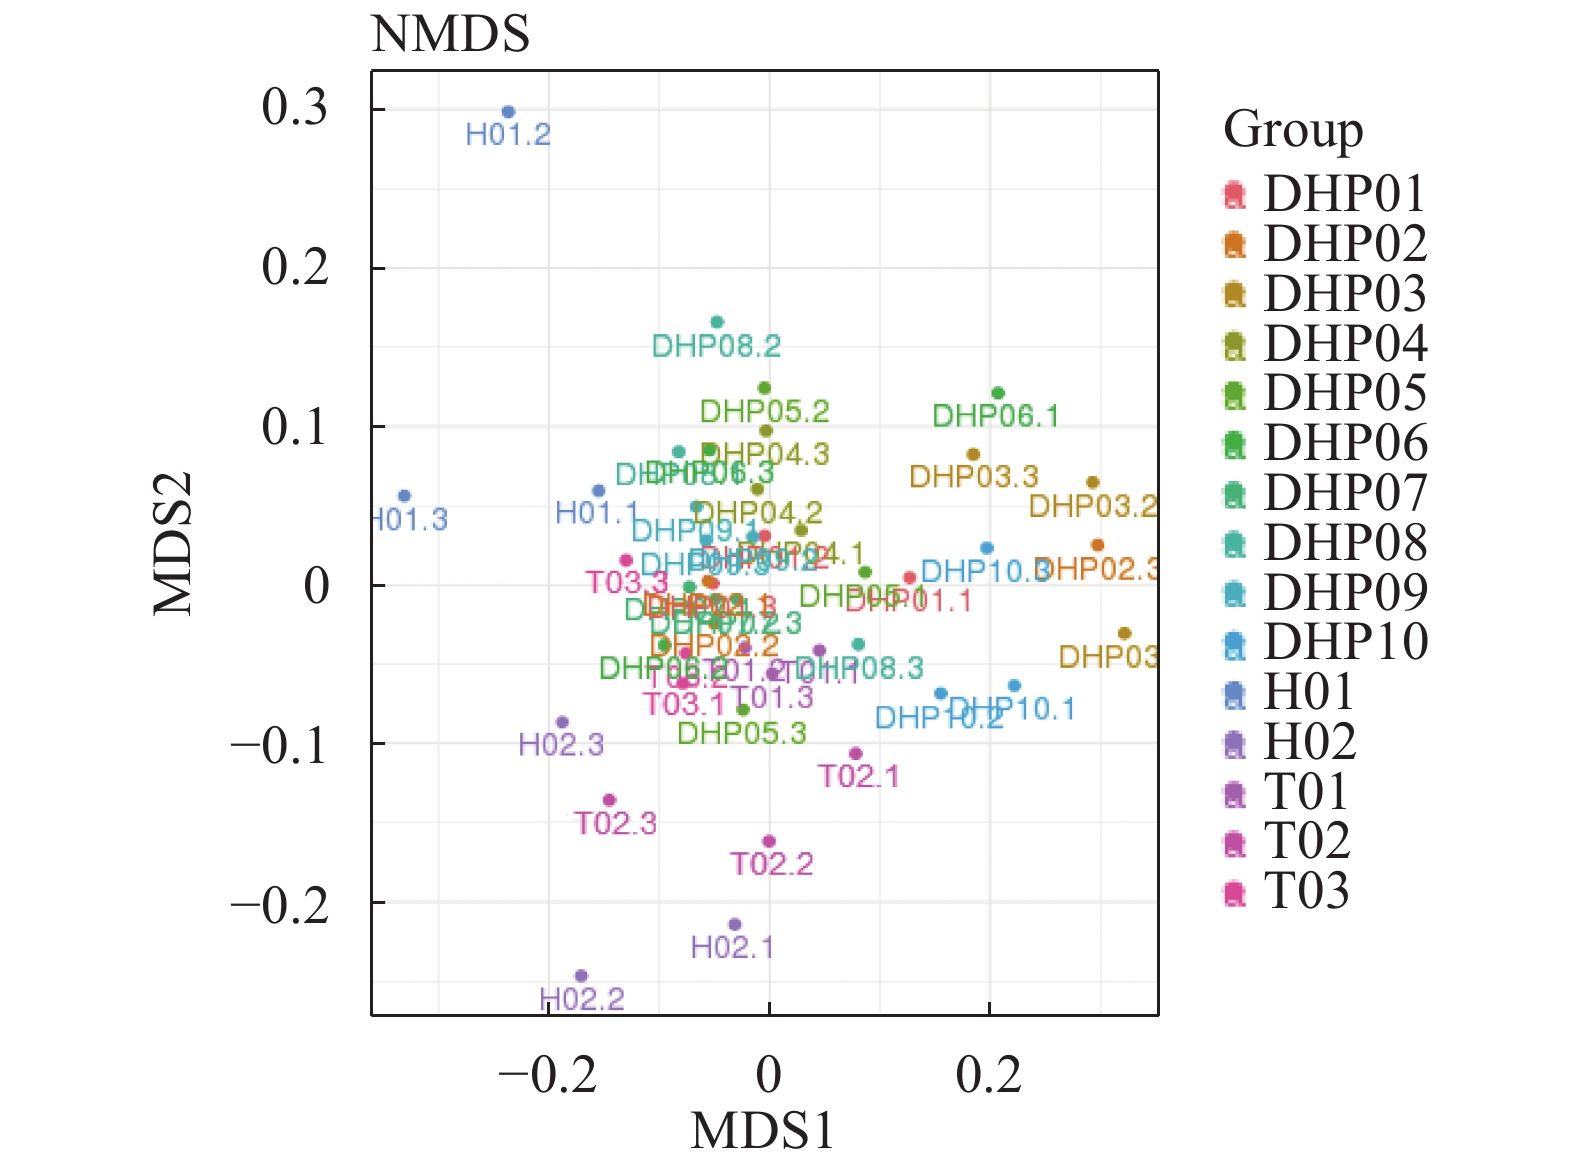
图 4 15组样品细菌群落结构非度量多维尺度分析
Figure 4. Nonmetric multidimensional scaling on microbial communities in 15 tea sample groups
![]()
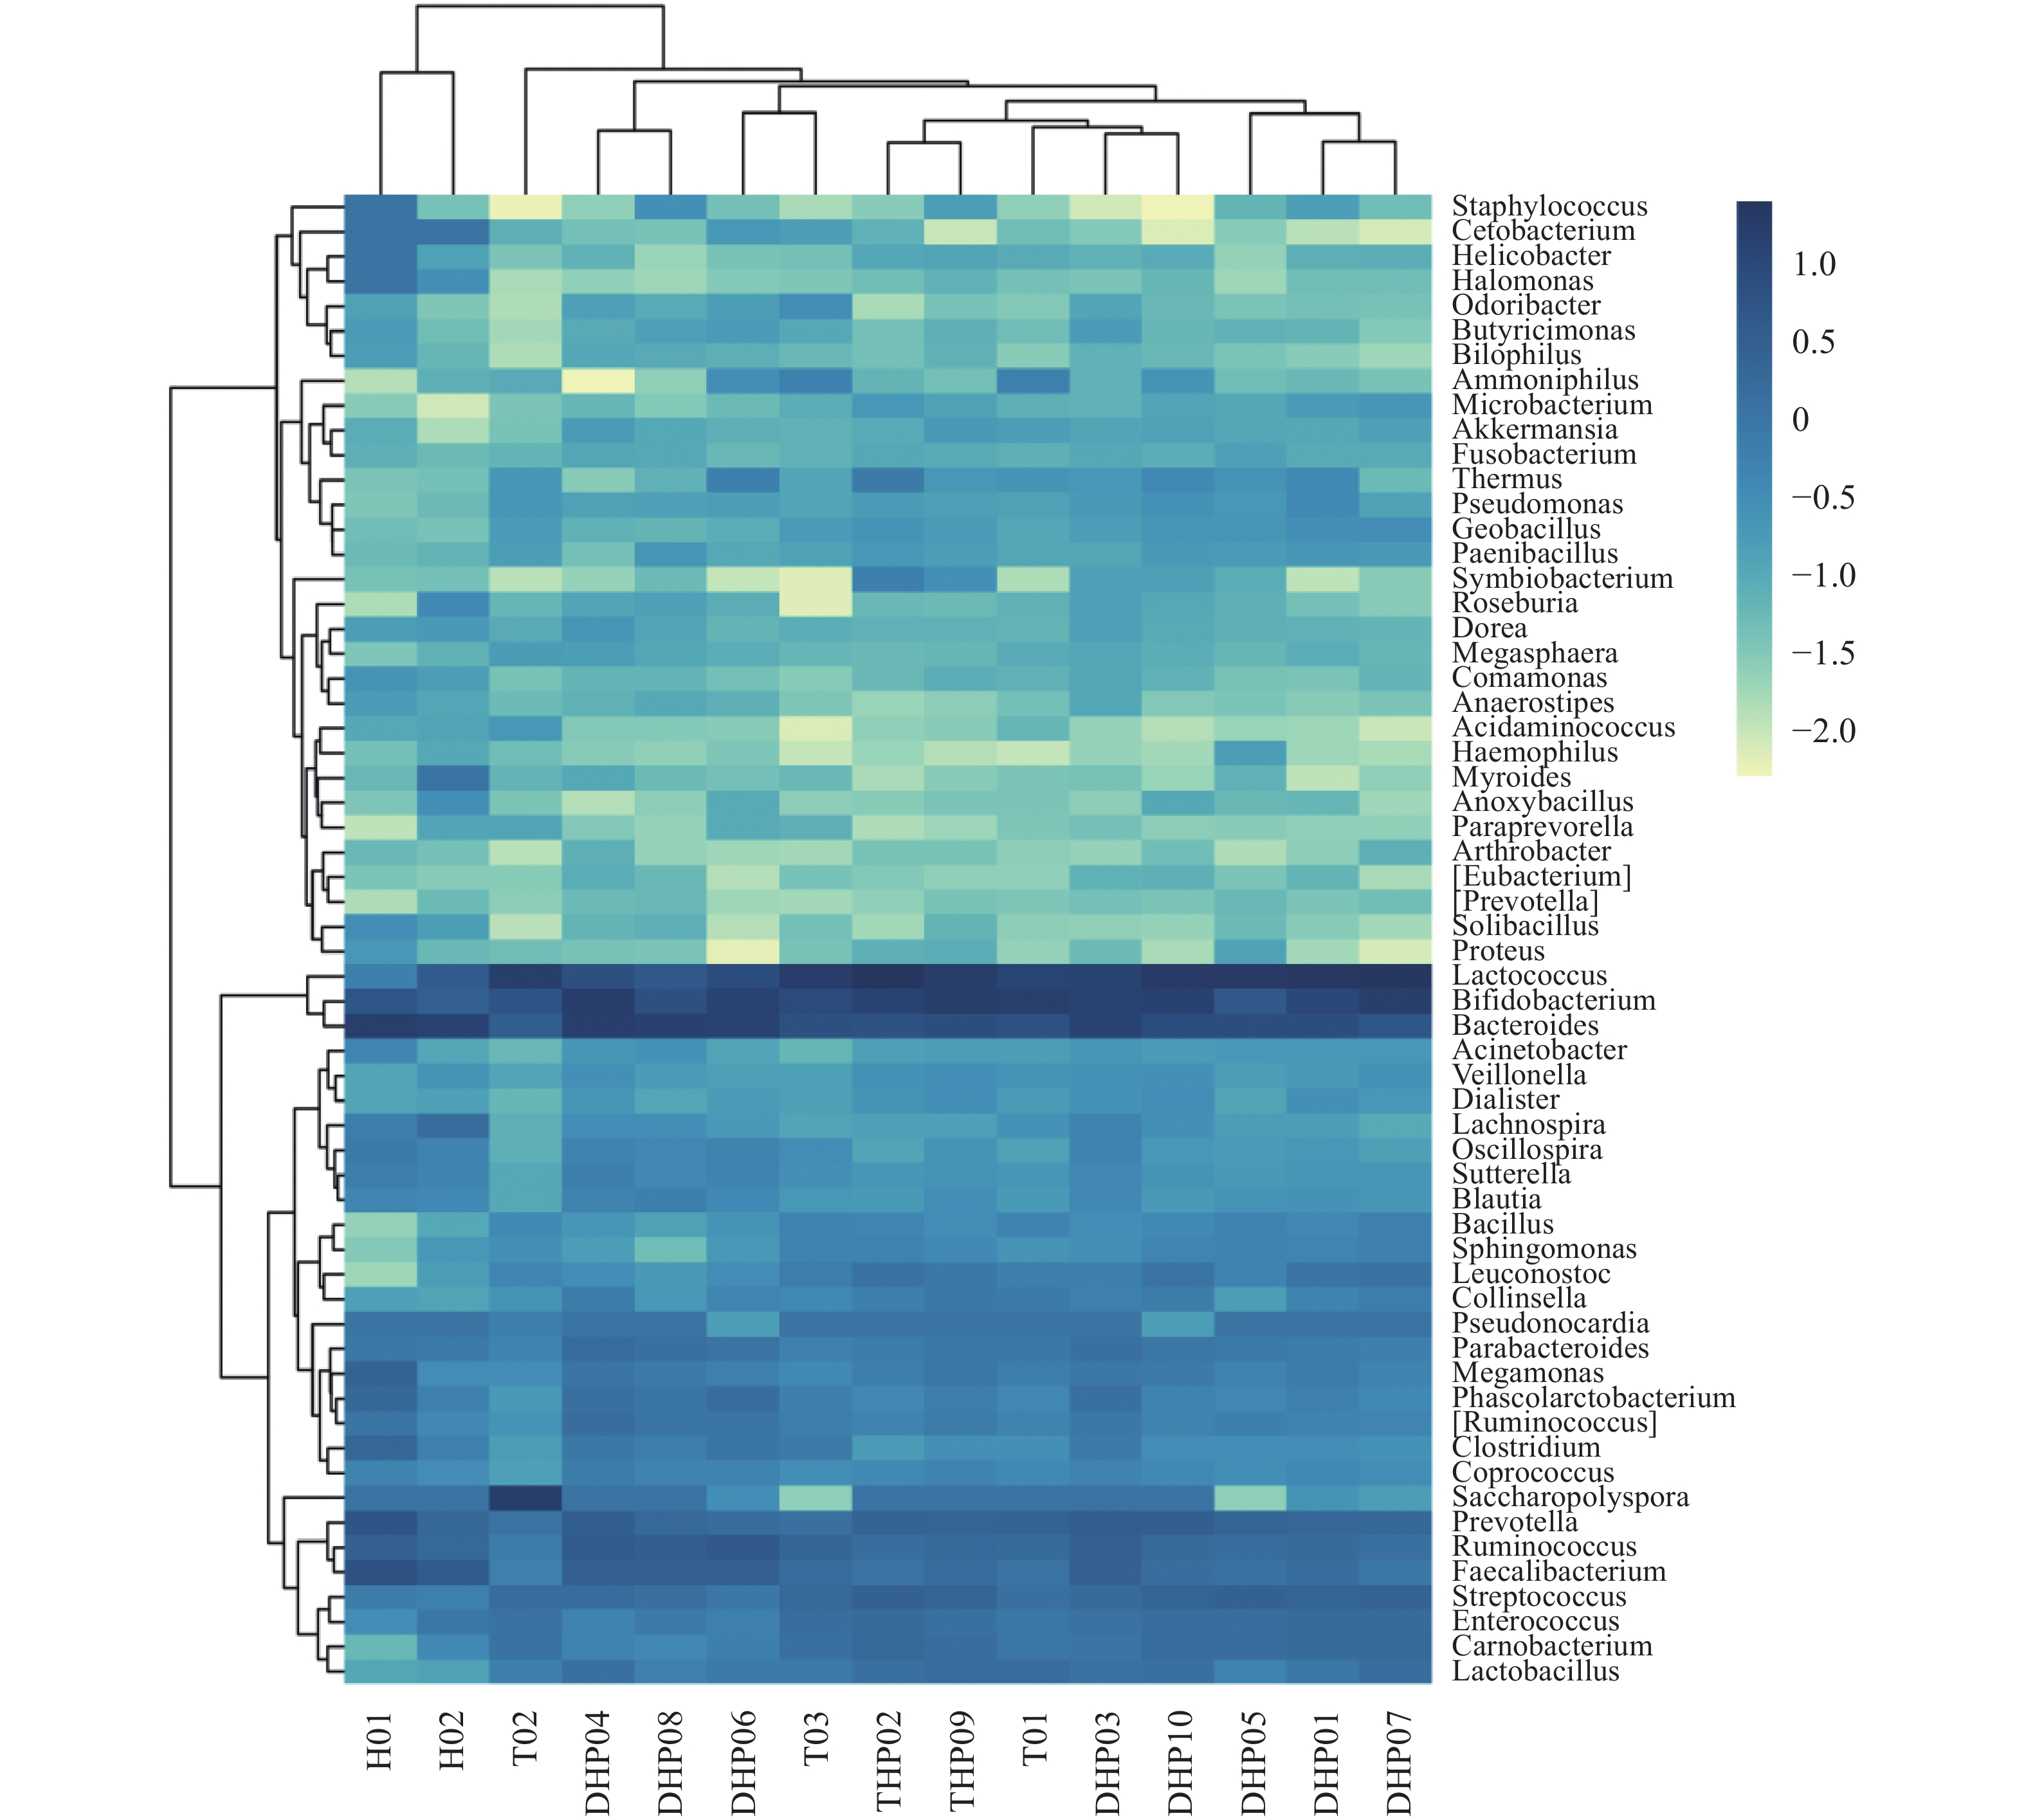
图 5 15组样品的物种丰度聚类热分析
Figure 5. Cluster heatmap of species abundance of microbial communities in 15 tea sample groups
![]()
图 6 线性判别分析(LDA)(a)及LEfSe分析(b)
Figure 6. Linear discriminant analysis (LDA) (a) and LEfSe analysis (b)
![]()
图 7 目水平上相关性前100物种的关联网络分析
Figure 7. Associative network diagram of first 100 species at order level
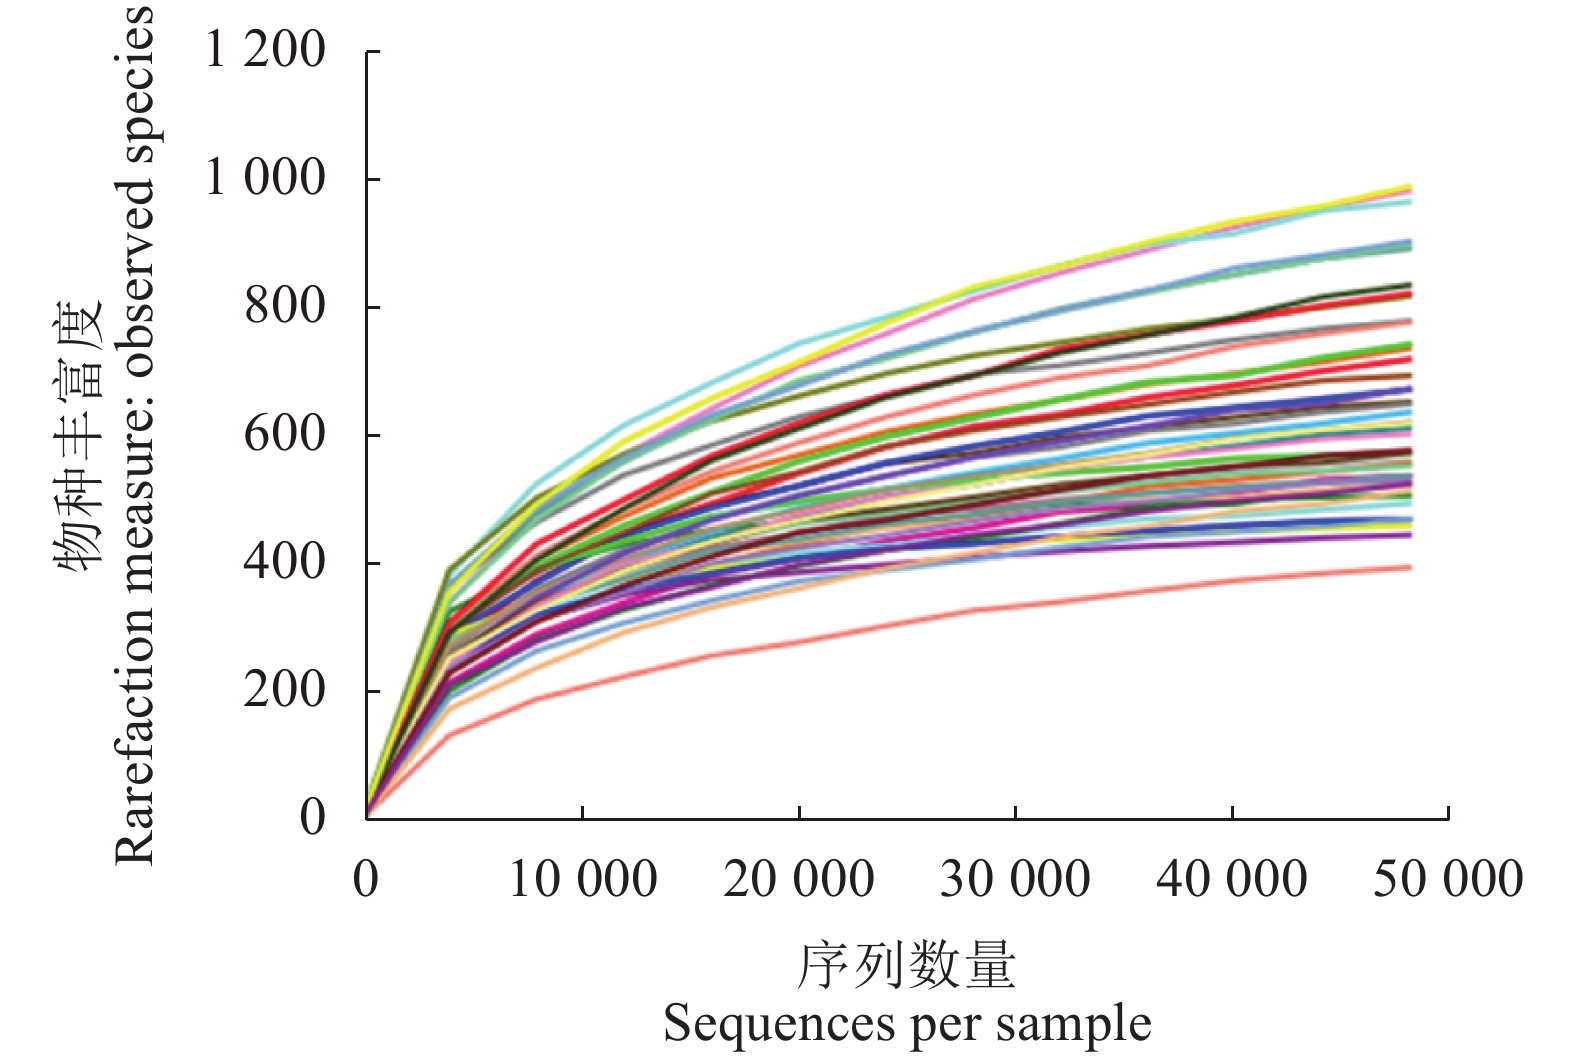
表 1 15组样品的测序统计结果与Alpha多样性指数
Table 1 Statistics on sequencing and alpha diversity indices of 15 tea sample groups
样品
SampleOTUs 统计结果 OTUs statistics 多样性指数 Diversity index 样品序列数
Sample SizeOTUs数目
OTUs No.OTUs序列数
OTUs Seq香农指数
Shannon辛普森指数
SimpsonChao1指数
Chao1物种丰富度
Observed Species覆盖度 Good's Coverage/% DHP01 135 571 786 120 856 4.812 a 0.881 a 764.350 a 566.333 a 99.4 a DHP02 137 093 840 120 902 4.674 a 0.869 a 826.814 a 590.667 a 99.3 a DHP03 131 607 1 154 116 546 5.834 a 0.940 a 1 160.929 a 821.667 a 99.0 a DHP04 135 649 868 120 950 5.921 a 0.947 a 821.182 a 642.333 a 99.4 a DHP05 137 637 922 121 189 4.941 a 0.873 a 918.760 a 625.667 a 99.3 a DHP06 130 334 830 115 224 5.548 a 0.936 a 786.825 a 590.667 a 99.4 a DHP07 134 957 698 120 356 4.468 a 0.856 a 626.202 a 500.333 a 99.5 a DHP08 114 134 804 95 325 5.621 a 0.920 a 778.539 a 624.000 a 99.4 a DHP09 123 240 672 108 448 4.873 a 0.883 a 650.761 a 522.333 a 99.5 a DHP10 137 220 947 122 884 5.077 a 0.895 a 910.136 a 679.333 a 99.2 a H01 119 468 628 86 562 5.867 a 0.948 a 587.594 a 517.667 a 99.7 a H02 117 039 513 104 593 5.366 a 0.908 a 505.416 a 437.667 a 99.8 a T01 114 298 642 98 978 4.682 a 0.875 a 601.000 a 507.667 a 99.6 a T02 110 810 613 89 148 4.992 a 0.913 a 614.176 a 486.000 a 99.6 a T03 103 525 555 77 016 4.894 a 0.888 a 554.331 a 468.667 a 99.7 a 注:表中的OTUs是相似性大于97%的有效OTUs,且已经注释;不同小写字母表示不同样品间达到显著性差异(P<0.05)。
Note: OTUs are valid and annotated OTUs with similarity greater than 97%; and data with different lowercase letters indicate significant difference between samples (P<0.05). 下载: 导出CSV
-
[1] ZHANG L, HO C T, ZHOU J, et al. Chemistry and Biological Activities of Processed Camellia sinensis Teas: A Comprehensive Review [J]. Comprehensive Reviews in Food Science and Food Safety, 2019, 18(5): 1474−1495. DOI: 10.1111/1541-4337.12479
[2] WEI C, YANG H, WANG S, et al. Draft genome sequence of Camellia sinensis var. sinensis provides insights into the evolution of the tea genome and tea quality [J]. Proceedings of the National Academy of Sciences, 2018, 115(18): E4151−E4158. DOI: 10.1073/pnas.1719622115
[3] 马存强, 杨超, 周斌星, 等. 微生物对茶叶中嘌呤生物碱代谢的研究进展 [J]. 食品科学, 2014, 35(21):292−296. DOI: 10.7506/spkx1002-6630-201421057 MA C Q, YANG C, ZHOU B X, et al. Recent progress in microbial metabolism of purine alkaloids in fermented tea [J]. Food science, 2014, 35(21): 292−296.(in Chinese) DOI: 10.7506/spkx1002-6630-201421057
[4] 陈林, 项丽慧, 王丽丽, 等. 乌龙茶和绿茶品种茶鲜叶儿茶素类和嘌呤碱HPLC指纹图谱特征比较 [J]. 福建农业学报, 2018, 33(1):21−28. CHEN L, XIANG L H, WANG L L, et al. HPLC Profiling of Catechins and Purine Alkaloids in Leaves of Oolong and Green Tea Cultivars [J]. Fujian Journal of Agricultural Sciences, 2018, 33(1): 21−28.(in Chinese)
[5] LI H L, JAYAWARDENA R S, XU W, et al. Lasiodiplodia theobromae and L. pseudotheobromae causing leaf necrosis on Camellia sinensis in Fujian Province, China [J]. Canadian Journal of Plant Pathology, 2019, 41(2): 277−284. DOI: 10.1080/07060661.2019.1569559
[6] 姚清华, 张居德, 苏德森, 等. 福建省茶叶主产区茶叶质量安全管理与隐患点比较分析 [J]. 福建农业学报, 2014, 29(4):393−397. DOI: 10.3969/j.issn.1008-0384.2014.04.018 YAO Q H, ZHANG J D, SU D S, et al. Quality and Safety Management on Tea in Fujian [J]. Fujian Journal of Agricultural Sciences, 2014, 29(4): 393−397.(in Chinese) DOI: 10.3969/j.issn.1008-0384.2014.04.018
[7] 许凌, 周卫龙, 宿迷菊. 茶叶微生物指标的现状与展望 [J]. 中国茶叶, 2012(7):14−16. DOI: 10.3969/j.issn.1000-3150.2012.07.008 XU L, ZHOU W L, SU M J. Present situation and prospect of microbial indicators of tea [J]. China tea, 2012(7): 14−16.(in Chinese) DOI: 10.3969/j.issn.1000-3150.2012.07.008
[8] BORAH A, DAS R, MAZUMDAR R, et al. Culturable endophytic bacteria of Camellia species endowed with plant growth promoting characteristics [J]. Journal of Applied Microbiology, 2019, 127(3): 825−844. DOI: 10.1111/jam.14356
[9] MADHAB M, BHATTACHARYYA P N, BEGUM R, et al. Microbial distribution and contamination in black tea [J]. Two and a Bud, 2019, 64(1): 26−31.
[10] 谌滢, 李适, 刘仲华, 等. 黑茶陈化机制研究进展 [J]. 湖南农业科学, 2016(12):118−122. CHEN Y, LI S, LIU Z H, et al. Research progress on the aging mechanism of black tea [J]. Hunan Agricultural Sciences, 2016(12): 118−122.(in Chinese)
[11] 徐正刚, 吴良, 刘石泉, 等. 黑茶发酵过程中微生物多样性研究进展 [J]. 生物学杂志, 2019, 36(3):92−95. DOI: 10.3969/j.issn.2095-1736.2019.03.092 XU Z G, WU L, LIU S Q, et al. Review for development of microbial diversity during dark tea fermentation period [J]. Journal of Biology, 2019, 36(3): 92−95.(in Chinese) DOI: 10.3969/j.issn.2095-1736.2019.03.092
[12] 罗红玉, 钟应富, 袁林颖, 等. 微生物在传统茶加工中的应用研究进展 [J]. 福建茶叶, 2013, 35(1):13−16. DOI: 10.3969/j.issn.1005-2291.2013.01.004 LUO H Y, ZHONG Y F, YUAN L Y, et al. Research progress on the application of microorganisms in traditional tea processing [J]. Tea in Fujian, 2013, 35(1): 13−16.(in Chinese) DOI: 10.3969/j.issn.1005-2291.2013.01.004
[13] TIAN J, ZHU Z, WU B, et al. Bacterial and Fungal Communities in Pu’er Tea Samples of Different Ages [J]. Journal of Food Science, 2013, 78(8): M1249−M1256. DOI: 10.1111/1750-3841.12218
[14] 刘石泉, 胡治远, 赵运林. 基于DGGE技术的茯砖茶发花过程细菌群变化分析 [J]. 生态学报, 2014, 34(11):3007−3015. LIU S Q, HU Z Y, ZHAO Y L. Analysis of bacterial flora during the fahua fermentation process of fuzhuan brick tea production based on DGGE technology [J]. Acta Ecologica Sinica, 2014, 34(11): 3007−3015.(in Chinese)
[15] RUI Y, WAN P, CHEN G, et al. Analysis of bacterial and fungal communities by Illumina MiSeq platforms and characterization of Aspergillus cristatus in Fuzhuan brick tea [J]. LWT, 2019, 110: 168−174. DOI: 10.1016/j.lwt.2019.04.092
[16] LI Q, CHAI S, LI Y D, et al. Biochemical components associated with microbial community shift during the pile-fermentation of primary dark tea [J]. Frontiers in Microbiology, 2018, 9: 1509. DOI: 10.3389/fmicb.2018.01509
[17] CAPORASO J G, KUCZYNSKI J, STOMBAUGH J, et al. QIIME allows analysis of high-throughput community sequencing data [J]. Nature Methods, 2010, 7(5): 335−336. DOI: 10.1038/nmeth.f.303
[18] ROGNES T, FLOURI T, NICHOLS B, et al. VSEARCH: a versatile open source tool for metagenomics [J]. PeerJ, 2016, 4: e2584. DOI: 10.7717/peerj.2584
[19] SEGATA N, IZARD J, WALDRON L, et al. Metagenomic biomarker discovery and explanation [J]. Genome Biology, 2011, 12(6): R60. DOI: 10.1186/gb-2011-12-6-r60
[20] 李艳春, 林忠宁, 陆烝, 等. 茶园间作灵芝对土壤细菌多样性和群落结构的影响 [J]. 福建农业学报, 2019, 34(6):690−696. LI Y C, LIN Z N, LU Z, et al. Microbial Diversity and Community Structure in Soil under Tea Bushes-Ganoderma lucidum Intercropping [J]. Fujian Journal of Agricultural Sciences, 2019, 34(6): 690−696.(in Chinese)
[21] ALOTAIBI K, RAYWARD-SMITH V, IGLESIA B D L. Nonmetric multidimensional scaling: A perturbation model for privacy-preserving data clustering [J]. Statistical Analysis & Data Mining the Asa Data Science Journal, 2014, 7(3): 175−193.
[22] DHARIWAL A, CHONG J, HABIB S, et al. MicrobiomeAnalyst: a web-based tool for comprehensive statistical, visual and meta-analysis of microbiome data [J]. Nucleic Acids Research, 2017, 45(W1): W180−W188. DOI: 10.1093/nar/gkx295
[23] FAUST K, RAES J. Microbial interactions: from networks to models [J]. Nature Reviews Microbiology, 2012, 10(8): 538−550. DOI: 10.1038/nrmicro2832
[24] FUHRMAN J A, CRAM J A, NEEDHAM D M. Marine microbial community dynamics and their ecological interpretation [J]. Nature Reviews Microbiology, 2015, 13(3): 133−146. DOI: 10.1038/nrmicro3417
[25] MOLLOY S. Environmental microbiology: disentangling syntrophy [J]. Nature Reviews Microbiology, 2014, 12(1): 7.
[26] HIBBING M E, FUQUA C, PARSEK M R, et al. Bacterial competition: surviving and thriving in the microbial jungle [J]. Nature Reviews Microbiology, 2010, 8(1): 15−25. DOI: 10.1038/nrmicro2259
[27] LI H, LI M, YANG X, et al. Microbial diversity and component variation in Xiaguan Tuo Tea during pile fermentation [J]. PLoS ONE, 2018, 13(2): e0190318. DOI: 10.1371/journal.pone.0190318
[28] XU Q, SUN M, NING J, et al. The Core Role of Bacillus subtilis and Aspergillus fumigatus in Pile-Fermentation Processing of Qingzhuan Brick Tea [J]. Indian Journal of Microbiology, 2019, 59(3): 288−294. DOI: 10.1007/s12088-019-00802-4
[29] XU A, WANG Y, WEN J, et al. Fungal community associated with fermentation and storage of Fuzhuan brick-tea [J]. International Journal of Food Microbiology, 2011, 146(1): 14−22. DOI: 10.1016/j.ijfoodmicro.2011.01.024
[30] MAO Y, WEI B Y, TENG J W, et al. Analyses of fungal community by Illumina MiSeq platforms and characterization of Eurotium species on Liupao tea, a distinctive post-fermented tea from China [J]. Food Research International, 2017, 99: 641−649. DOI: 10.1016/j.foodres.2017.06.032
[31] ZHANG W, YANG R, FANG W, et al. Characterization of thermophilic fungal community associated with pile fermentation of Pu-erh tea [J]. International Journal of Food Microbiology, 2016, 227: 29−33. DOI: 10.1016/j.ijfoodmicro.2016.03.025
[32] 赵仁亮, 胥伟, 吴丹, 等. 基于Illumina MiSeq技术分析不同地域加工的茯砖茶中微生物群落多样性 [J]. 生态学杂志, 2017, 36(7):1865−1876. ZHAO R L, XU W, WU D, et al. Microbial community diversity of Fu brick tea produced in different regions by Illumina MiSeq technology [J]. Chinese Journal of Ecology, 2017, 36(7): 1865−1876.(in Chinese)
[33] FU J Y, LV H P, CHEN F. Diversity and Variation of Bacterial Community Revealed by MiSeq Sequencing in Chinese Dark Teas [J]. PLoS ONE, 2016, 11(9): e0162719. DOI: 10.1371/journal.pone.0162719
[34] 宁伟泽, 徐军. 金花普洱茶微生物组成谱的ITS和16sRNA基因文库研究 [J]. 中国茶叶, 2018, 40(5):63−66. DOI: 10.3969/j.issn.1000-3150.2018.05.010 NING W Z, XU J. Study on ITS and 16sRNA gene library of microbial composition spectrum of jinhua puer tea [J]. China Tea, 2018, 40(5): 63−66.(in Chinese) DOI: 10.3969/j.issn.1000-3150.2018.05.010
[35] MUDAU F N, SALEHI B, SHARIFI-RAD M, et al. Understanding Camellia sinensis using Omics technologies along with endophytic bacteria and environmental roles on metabolism: A review [J]. Applied Sciences (Switzerland), 2019, 9(2): 281. DOI: 10.3390/app9020281
[36] AZAM M W, KHAN A U. Updates on the pathogenicity status of Pseudomonas aeruginosa [J]. Drug Discovery Today, 2019, 24(1): 350−359. DOI: 10.1016/j.drudis.2018.07.003
[37] SHARMA A K, PANDIT J, GAUTAM V, et al. Optimization of culture conditions for maximizing Extracellular Organophosphorus hydrolase activity in pseudomonas strains with Chlorpyrifos degradation potential [J]. Journal of Pharmacognosy and Phytochemistry, 2019, SP1: 322−326.
[38] WALLACE R L, HIRKALA D L, NELSON L M. Postharvest biological control of blue mold of apple by Pseudomonas fluorescens during commercial storage and potential modes of action [J]. Postharvest Biology & Technology, 2017, 133: 1−11.
[39] CHEN H, HAO Z, WANG Q, et al. Occurrence and risk assessment of organophosphorus pesticide residues in Chinese tea [J]. Human and Ecological Risk Assessment: An International Journal, 2016, 22(1): 28−38. DOI: 10.1080/10807039.2015.1046420
[40] SHARMA A, PANDIT J, SHARMA R, et al. Biodegradation of Chlorpyrifos by Pseudomonas Resinovarans Strain AST2. 2 Isolated from Enriched Cultures [J]. Current World Environment, 2016, 11(1): 267−278. DOI: 10.12944/CWE.11.1.33
[41] DONG J, BIAN Y, LIU F, et al. Storage stability improvement of organophosphorus insecticide residues on representative fruit and vegetable samples for analysis [J]. Journal of Food Processing and Preservation, 2019: e14048.
[42] 王小军, 张绵松, 袁文鹏, 等. 液态发酵茶饮料菌株分离鉴定及发酵特征研究 [J]. 农产品加工(学刊), 2010(8):30−35. WANG X J, ZHANG M S, YUAN W P, et al. Isolation and identification and fermentation characteristic of microorganism used for liquid fermented tea drink [J]. The Processing of Agricultural Products, 2010(8): 30−35.(in Chinese)
[43] SONG A A L, IN L L A, LIM S H E, et al. A review on Lactococcus lactis: from food to factory [J]. Microbial cell factories, 2017, 16(1): 55. DOI: 10.1186/s12934-017-0669-x
[44] 杨浩, 杨晓妮, 张国珍, 等. 窖水中微生物降解污染物的关键细菌 [J]. 环境科学, 2018, 39(10):376−387. YANG H, YANG X N, ZHANG G Z, et al. Key bacteria for microbial degradation of pollutants in cellar water [J]. Environmental Science, 2018, 39(10): 376−387.(in Chinese)
[45] CHEN Y, LI Q, XIA C, et al. Effect of selenium supplements on the antioxidant activity and nitrite degradation of lactic acid bacteria [J]. World Journal of Microbiology and Biotechnology, 2019, 35(4): 61. DOI: 10.1007/s11274-019-2609-x
[46] YUE X, YU G, LU Y, et al. Effect of dissolved oxygen on nitrogen removal and the microbial community of the completely autotrophic nitrogen removal over nitrite process in a submerged aerated biological filter [J]. Bioresource Technology, 2018, 254: 67−74. DOI: 10.1016/j.biortech.2018.01.044
[47] XU S, LU W J, MUSTAFA M F, et al. Co-existence of anaerobic ammonium oxidation bacteria and denitrifying anaerobic methane oxidation bacteria in sewage sludge: community diversity and seasonal dynamics [J]. Microbial Ecology, 2017, 74(4): 832−840.
-
期刊类型引用(1)
1. 唐超,孔维嵩,王晓鹃,赵景鹏,林海,焦洪超. 基于Meta分析的生猪氮排泄量预测模型构建. 动物营养学报. 2023(06): 4001-4010 .  百度学术
百度学术
其他类型引用(1)


计量
- 文章访问数: 1748
- HTML全文浏览量: 691
- PDF下载量: 42
- 被引次数: 2
